Pull up four listing sites for Hartford's West End neighborhood in the same week and you'll get four different answers to what should be a simple question. As of May 2026, Redfin's data put the median sale price at $419,859, down 29.1 percent from a year earlier. Movoto's June 2026 figures showed West End homes listed at a median asking price of $587,000. A separate tracker's trailing twelve-month sold data showed a median of $495,000, up 37 percent from the prior year. And a widely used automated home-value estimate landed closer to $330,000.
Same neighborhood. Same general stretch of 2026. Four numbers that don't agree with each other by margins of $100,000 or more.
If you're comparing Hartford neighborhoods before you buy, this matters more than it might seem. The instinct is to treat a median price like a fact you can bank on, then get confused or suspicious when the next site you check shows something wildly different. The real explanation isn't that one site is right and the others are wrong. It's that these numbers aren't measuring the same thing, and even when they are, Hartford's neighborhoods sell few enough homes in a given stretch that the math behind a "median" gets shaky fast.
Four Sites, Four Different Questions
Here's what each of those West End numbers actually represents:
| Source | What it measures | Figure | Window |
|---|---|---|---|
| Closed-sale median (Redfin-style) | Actual sale prices that closed | $419,859 | May 2026, down 29.1% YoY |
| Trailing-year closed median | Sales closed over the prior 12 months | $495,000 | Up 37% vs. prior 12 months |
| Active-listing median | What sellers are currently asking, not what buyers are paying | $587,000 | June 2026 |
| Automated value estimate | An algorithm's guess across the whole neighborhood's housing stock, occupied or not | ~$330,000 | Current snapshot |
Three of those four numbers describe different slices of activity: what just sold, what sold over a longer stretch, and what's currently for sale but hasn't traded yet. The fourth doesn't describe a transaction at all. It's a model estimating value for every home in the neighborhood, including the ones that haven't been listed, sold, or updated in decades. None of these are wrong. They're answering different questions, and a headline "median home price" almost never tells you which question you're getting an answer to.
The Mix, Not the Market, Moved
Here's the part that actually explains the swing, and it's the detail worth sitting with if you're comparing Hartford neighborhoods on price alone. In the same stretch where West End's median sale price reportedly climbed 37 percent year over year, its price per square foot reportedly fell about 4 percent.
Those two facts can both be true at once, and the reason is instructive. A median price tracks the middle sale, whatever that sale happens to be in a given month. A price-per-square-foot figure adjusts for size. If the homes that happened to close this year skewed larger, more renovated, or simply pricier per unit than last year's batch, the median headline jumps even though a buyer comparing two similar houses side by side wouldn't see anything like a 37 percent gain. The underlying value of a comparable home barely moved. The mix of what sold is what changed.
This is the mechanism that makes single-neighborhood medians so unstable in a city like Hartford. Citywide, roughly 44 to 47 homes sold per month as of the first half of 2026. Split that across the eighteen or so distinct neighborhoods Hartford tracks, and you can end up with a handful of closings, sometimes fewer, driving the "median" for any one of them in a given month. One large historic sale on Asylum Avenue or one distressed multi-family deal can move a neighborhood median by tens of thousands of dollars without reflecting any actual shift in what a typical buyer will pay.
The City-Level Number Has the Same Problem
If you assumed the citywide figure would be steadier, it isn't. One tracker put Hartford's citywide median at $324,000 in March 2026, up 17.2 percent year over year. A different tracker, using public records and MLS data, put the citywide median at $245,000 as of a similar window, down nearly 4 percent year over year. That's an almost $80,000 gap on the same city in roughly the same season.
The pattern is the same one driving West End's swings, just at a larger scale. With well under fifty sales closing citywide most months, the composition of that month's closings, condos versus single-families, distressed sales versus renovated ones, downtown high-rises versus Blue Hills triple-deckers, has an outsized effect on where the median lands. A city-level number isn't immune to thin-market noise. It's just thin-market noise with a bigger denominator.
What This Looks Like Street by Street
The practical upshot is that "Hartford" isn't one market, and neither is any single named neighborhood inside it. Each pocket has its own supply story, and that story matters more than whatever median happens to be circulating that month.
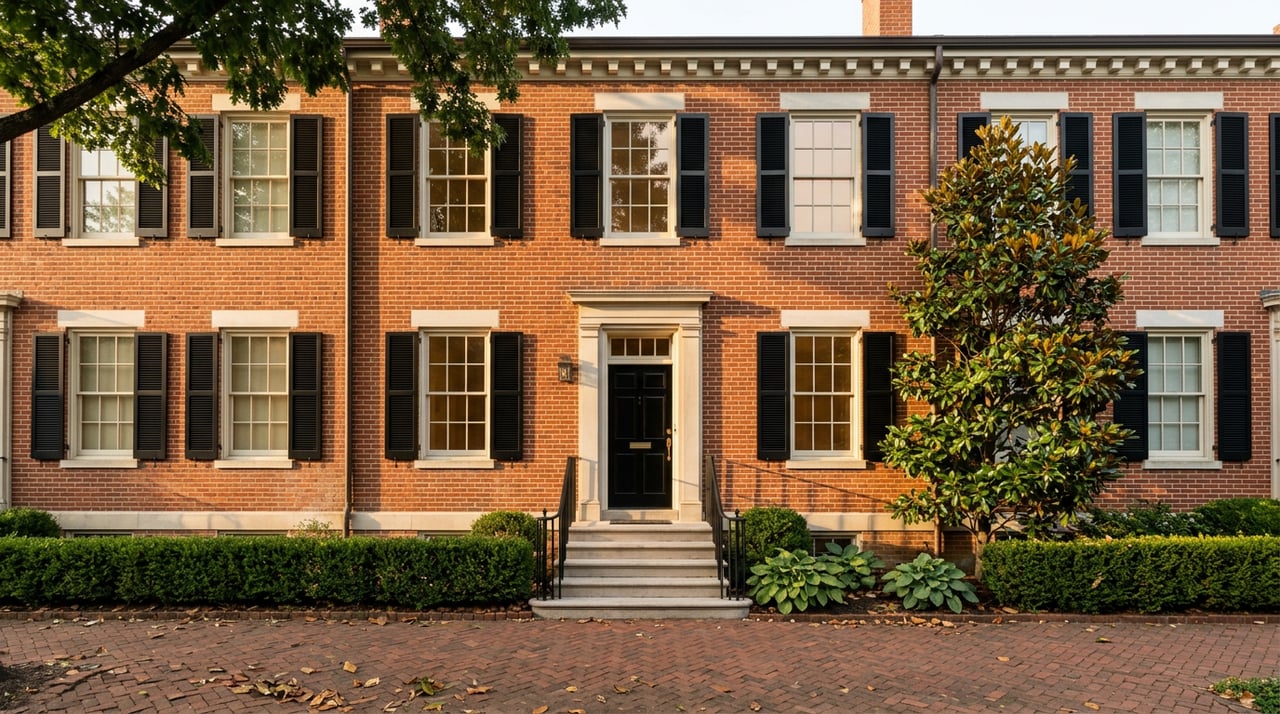
West End carries a stock of large, century-old single-family homes clustered near Elizabeth Park, the kind of property that doesn't trade often and, when it does, can single-handedly reshape a monthly median in either direction. This is the neighborhood where the four-source discrepancy above is least surprising once you know how few of these homes change hands in a typical month.
Parkville is a different animal entirely, and one worth watching for a different reason. The neighborhood's old typewriter factories, once home to Underwood and Royal, have spent the past several years being converted into artist studios, lofts, and gallery space, with Parkville Market and CTfastrak transit access as the draw. Developer Dakota Partners has proposed converting the century-old Smith Worthington Saddlery mill at 287 Homestead Ave into market-rate apartments under the name Saddlery Lofts, and has floated a separate 180-unit project called Edge 400 on New Park Avenue, on the site of the former Bow Tie Cinemas. Projects like these don't just add units. They change what's in the comp set. A neighborhood absorbing new loft supply on a construction timeline, rather than an organic sales timeline, will show price swings that have more to do with when a building opens than with any underlying shift in demand.
Blue Hills and Frog Hollow tell a third story, and it's one where the home-price median matters less than the rent line. Hartford's classic three-bedroom triple-deckers, the backbone of the city's older multifamily stock, have seen asking rents climb from roughly $1,200 a month in 2020 to around $1,850 a month in 2026. For an investor evaluating these corridors, that rent trajectory is a far more reliable signal of neighborhood health than a home-sale median built on a handful of closings.
What to Ask Instead of Trusting the Number
None of this means market data is useless. It means the number by itself isn't the whole answer. Before you anchor on any Hartford neighborhood price you find online, it's worth asking a few questions:
- Is this a closed-sale price, an asking price, or an algorithmic estimate? They answer different questions and shouldn't be compared to each other.
- How many sales is this median actually built on? A number based on three or four closings moves differently than one based on thirty.
- Has price per square foot moved in the same direction as the median? If not, the mix of what's selling changed, not necessarily the value of a comparable home.
- Is there a construction pipeline nearby, as in Parkville, that's adding supply that didn't exist in last year's comp set?
A number without that context is a headline. A number with that context is something you can actually use to make an offer, price a listing, or decide whether a neighborhood fits your budget.
Frequently Asked Questions
Why did West End's numbers vary so much between sites? Because the sites weren't all measuring the same thing. Some track closed sales, one tracked current asking prices, and one uses an automated valuation model that estimates every home in the neighborhood rather than only the ones that recently sold.
Does this mean online home value estimates are unreliable everywhere? It means they're most unreliable in markets with low monthly sales volume, which describes most individual Hartford neighborhoods. In a market with hundreds of monthly closings, a median stabilizes fast. In a market with a handful, one unusual sale can swing it.
What should I actually rely on instead? A comparative market analysis built on recent, similar sales in the specific pocket you're considering, not a citywide or even neighborhood-wide median pulled from a single site.
If you're weighing a specific Hartford neighborhood and want a number built on the actual comps for that block and property type, not a citywide average or an algorithm's best guess, that's exactly the kind of groundwork Concierge Real Estate Co puts together before you make an offer or list a home. Get Your Instant Home Valuation and we'll walk you through what the real comps say, not just what the nearest website happens to show.